Solana Bounces Back: Bullish Wave Builds Above $155 After Sharp Dip
Werte in diesem Artikel
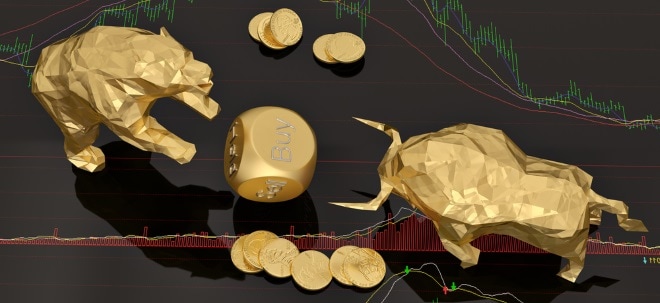
In a recent post on X, crypto analyst Grayhoood observed that Solana (SOL) is currently showing signs of a bullish trend. Over the past 24 hours, the price has climbed by 2.8%, with candlestick charts revealing a noticeable upward trajectory. Solana Stochastics And CCI Signal Short-Term StrengthEarlier in the day, SOL briefly dipped to around $151 but managed to recover steadily, reaching a current price of $155.35. Grayhoood pointed out that this short-term strength is consistent with Solana’s 7-day performance, which shows a modest 1.4% increase. However, the longer-term outlook remains volatile, with SOL still down by 3.9% over the past year. Grayhoood revealed that technical indicators are suggesting a cautiously optimistic outlook for SOL. As price action continues to show signs of recovery, the Relative Strength Index (RSI) is likely positioned in a neutral zone, indicating the recent uptick. This positioning allows space for further gains, but also signals a potential shift into overbought territory if SOL’s price surges too rapidly.The Stochastic Oscillator and Commodity Channel Index (CCI) also point to short-term bullish momentum, especially with SOL breaking through the $154 resistance level. These indicators suggest that buyers are regaining control. However, Grayhoood cautioned that while momentum appears to be building, the recent price dip observed earlier in the day reveals that sellers are not entirely out of the picture.Recovery Gains Traction, But Yearly Losses Still Weigh InTo further reinforce his claim, the analyst pointed to Solana’s moving averages, which currently present a mixed but insightful technical outlook. In the short term, the 7-day and 14-day moving averages hint at a hold or mild buying pressure. This aligns with SOL’s recent bounce from $151 to $155.35, signaling that momentum may be shifting in favor of the bulls.However, when viewed from a broader lens, long-term averages continue to reflect lingering weakness. The 30-day and yearly trends, which show declines of 9.3% and 3.9% respectively, suggest that the larger market remains cautious. These figures reveal that while the recent gains are encouraging, they have not fully reversed the bearish structure seen over the past months.Overall, the analyst believes that despite the volatility seen over the past few weeks, market sentiment is beginning to lean bullish in the short term. Solana’s recent performance, supported by its ability to reclaim key levels and maintain upward momentum, offers a more favorable outlook heading into the near future. If current trends persist and key resistances are successfully challenged, the path may open for a broader shift in sentiment.Weiter zum vollständigen Artikel bei NewsBTC
Ausgewählte Hebelprodukte auf Sharp
Mit Knock-outs können spekulative Anleger überproportional an Kursbewegungen partizipieren. Wählen Sie einfach den gewünschten Hebel und wir zeigen Ihnen passende Open-End Produkte auf Sharp
Der Hebel muss zwischen 2 und 20 liegen
| Name | Hebel | KO | Emittent |
|---|
| Name | Hebel | KO | Emittent |
|---|
Quelle: NewsBTC
Nachrichten zu Sharp Corp.
Analysen zu Sharp Corp.
| Datum | Rating | Analyst | |
|---|---|---|---|
| 21.08.2012 | Sharp sell | Citigroup Corp. | |
| 14.08.2012 | Sharp sell | Citigroup Corp. | |
| 18.06.2012 | Sharp hold | Deutsche Bank AG | |
| 12.04.2012 | Sharp neutral | Banc of America Securities-Merrill Lynch | |
| 11.04.2012 | Sharp neutral | Nomura |
| Datum | Rating | Analyst | |
|---|---|---|---|
| 29.09.2010 | Sharp kaufen | Asia Investor | |
| 03.05.2010 | Sharp chancenreich | Der Aktionär | |
| 08.07.2009 | Sharp bleibt ein Kauf | Der Aktionär | |
| 30.04.2009 | Sharp einsteigen | Asia Investor | |
| 08.08.2008 | Sharp kaufen | Fuchsbriefe |
| Datum | Rating | Analyst | |
|---|---|---|---|
| 18.06.2012 | Sharp hold | Deutsche Bank AG | |
| 12.04.2012 | Sharp neutral | Banc of America Securities-Merrill Lynch | |
| 11.04.2012 | Sharp neutral | Nomura | |
| 27.10.2011 | Sharp neutral | Macquarie Research | |
| 01.08.2011 | Sharp hold | Citigroup Corp. |
| Datum | Rating | Analyst | |
|---|---|---|---|
| 21.08.2012 | Sharp sell | Citigroup Corp. | |
| 14.08.2012 | Sharp sell | Citigroup Corp. |
Um die Übersicht zu verbessern, haben Sie die Möglichkeit, die Analysen für Sharp Corp. nach folgenden Kriterien zu filtern.
Alle: Alle Empfehlungen

